The Graph Explained
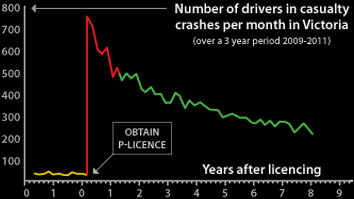
This graph shows the number of Victorian drivers in fatal or injury crashes from 2009 until 2011 by licensing stage. The graph demonstrates that learners have a very low level of crash risk but as soon as they get their probationary license, their crash risk increases by 30 times. Their crash risk gradually decreases as they mature and gain further experience.